Maps
Interactive Map
This map is an interactive visual where riddles can be selected based on their metadata. Points representing riddling events can be filtered by date, archive, or whether the dataset includes the actual riddle for the event. Every riddle is clickable, revealing more information about the event that took place.
The riddles in this app represent a large portion of the dataset collected by the Riddles Project.
Introduction to the Story Map
Scroll through the story map to see the ways different riddles connect. The story map helps clarify questions about riddle patterns and movement identified over the course of the project.
Diving into the riddles
Now that we have a sense of the distribution of riddles by location, let's take a deep dive into the distribution of riddling events over time. This interactive chart allows you to see how riddles are distributed over the week, year, and even across the entire 300-year period of riddling.
The interactive graph below also shows how riddling events were distributed by the days of the week, by the month, and across an approximately 250-year period. Toggling between "event date" and "newspaper issue date" shows differences in when the events actually occurred and when they were reported on. Event dates represent the days in which the riddling suppers took place. Newspaper dates indicate when the culinary events were publicised.
By looking at the monthly distribution of events, we can see that riddling events were not typically held in the summer. When looking at event scheduling by week, it becomes clear that riddling events were usually held on the weekends. A birds-eye view of the dataset shows that riddling events were most popular between 1890 and 1920.
The graph further indicates that the popularity of Conundrum Suppers peaked first in the United States, then in the United Kingdom, and finally in Canada. Earliest events appear in the UK, suggesting that riddling dinners originated in Europe before moving the US. Might the popularity of culinary riddles in the US have influenced their renewed popularity in the UK during the early 20th century?
It is difficult to offer definitive conclusions. Many of the newspaper archives consulted are incomplete, and the availability of archival information has inevitably influenced the results of our findings. However, the sheer number of events identified is itself suggestive. More research is warranted, and we hope that our exhibition will pique interest and prompt others to join our journey of exploration.
Peaks in Riddling Events
Now that we have a sense of the distribution of riddles over time, let's take a closer look at the riddles that make up these "hot points" of riddling in the late 1800s and early 1900s.
This story map illuminates the riddles from the hottest period of riddling, from 1890 to 1920, where more than 90% of the riddles from our dataset were published.
Here's a graphic illustrating the distribution of riddles from our dataset by year:
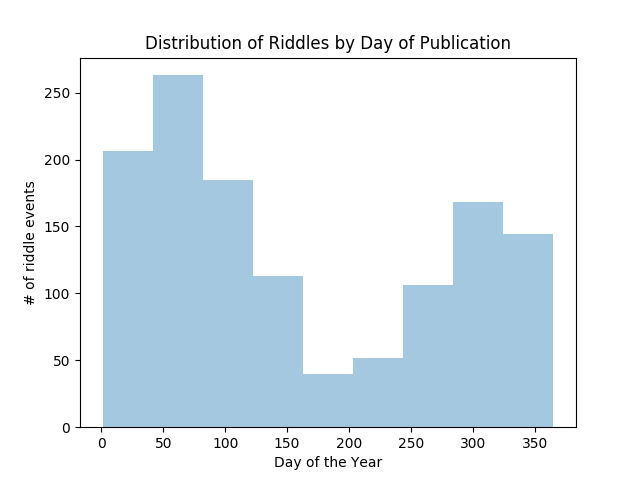
Riddling Events Over the Holidays
What about the holidays? How do they affect riddling practices?
Here's the graphic breaking down riddling events by day of the year. There's a strong peak around the winter holidays, and a deep drop in the summertime.